- Home
- Regional Initiatives
- Regional Modeling Program
- Advanced Freight Model
Tour-based Freight Model
In recognition of the importance of freight in the Triad, PART, the North Carolina Department of Transportation (NCDOT), and the Triad Metropolitan Planning Organizations (Burlington-Graham, Greensboro, High Point, and Winston-Salem) embarked on a three-phased approach to develop an enhanced freight component for the Piedmont Triad Regional Travel Demand Model (RTDM). The goals are to provide a safe freight transportation system, support the region's economic well-being, and achieve efficiency in operations and investment in the freight transportation system.
Creating better data and models will enable state, regional, and local planners to better predict freight movement trends, and make better informed project investment decisions. The end result of this study will be information that can be used to inform land use planning, transportation planning and project prioritization.
Phase One
Identify existing freight nodes, characteristics and commodities.
Highlights from Phase I Included 158 freight and distribution establishment interviews, a 969 record Freight Node Database, 139 distribution centers identified.
Phase II
Development of an Advanced Freight Model and Integration with RTDM
Develop an advanced freight as a sub-component to the Regional Travel Demand Model (RTDM)
The primary components are:
- Regional Freight Truck-Touring Model
- Regional Commercial Vehicle Touring Model
The RTDM contains an existing passenger model (gray box) that is used to estimate personal travel by auto and other modes. The passenger model outputs trip tables describing the number of zone to zone trips for personal travel (blue box in lower left corner) that are assigned to the regional highway network using a static assignment model (red box). The components of the freight model are included within the red dashed line. The model’s first component is the firm synthesis model (orange box in upper left of the freight model). The firm synthesis model creates a list of business establishments within the model region (blue box labeled "Synthetics Firms") that is an input to both the freight demand model and the Commercial Vehicle Touring Model (CVTM).
The freight demand model (orange box in upper right of the freight model) simulates the movement of commodities to, from, and within the Piedmont Triad. The output from this model component is a list of shipments to and from business establishments in the model region (blue box labeled "Shipments") that is an input to the Freight Truck Touring Model (FTTM).
Freight Truck Touring Model
The FTTM simulates truck movements within the model region that deliver and pick up freight shipments at business establishments. The model is a tour-based model, and builds a set of truck tours including transfer points at which the shipment is handled before delivery/after pickup for shipments with a more complex supply chain (i.e., a warehouse, distribution center, or consolidation center) and the suppliers and buyer of shipments where those are within the model region. The shipment list from the freight demand model is used as demand input for the FTTM and describes the demand for delivery and pick up activity in the model region that must be connected by truck movements.
Commercial Vehicle Touring Model
The CVTM simulates the remainder of the travel of light, medium, and heavy trucks that is for commercial purposes, i.e., providing services and goods delivery to households and services to businesses. As with the FTTM, the CVTM is a tour-based model, but this time demand is derived from the characteristics of the business establishments and households in the model region and as such is not affected by any demand derived from the freight demand model. That is, while the FTTM simulates truck tours based on commodity flows, the CVTM generates and simulates truck and light-duty vehicle movements based on demand for services and goods from certain industries.
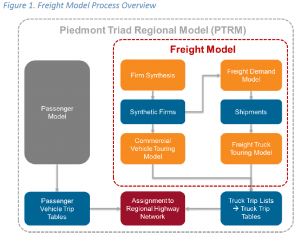
Output
The outputs from both the FTTM and the CVTM are converted to trip tables (blue box labeled “Truck Trip Lists…”). In this case, a trip list from each model with trip start and end location and trip timing information is aggregated into zone to zone trips by time period that can be assigned to the regional highway network (red box) in the RTDM along with trips tables from the passenger model.
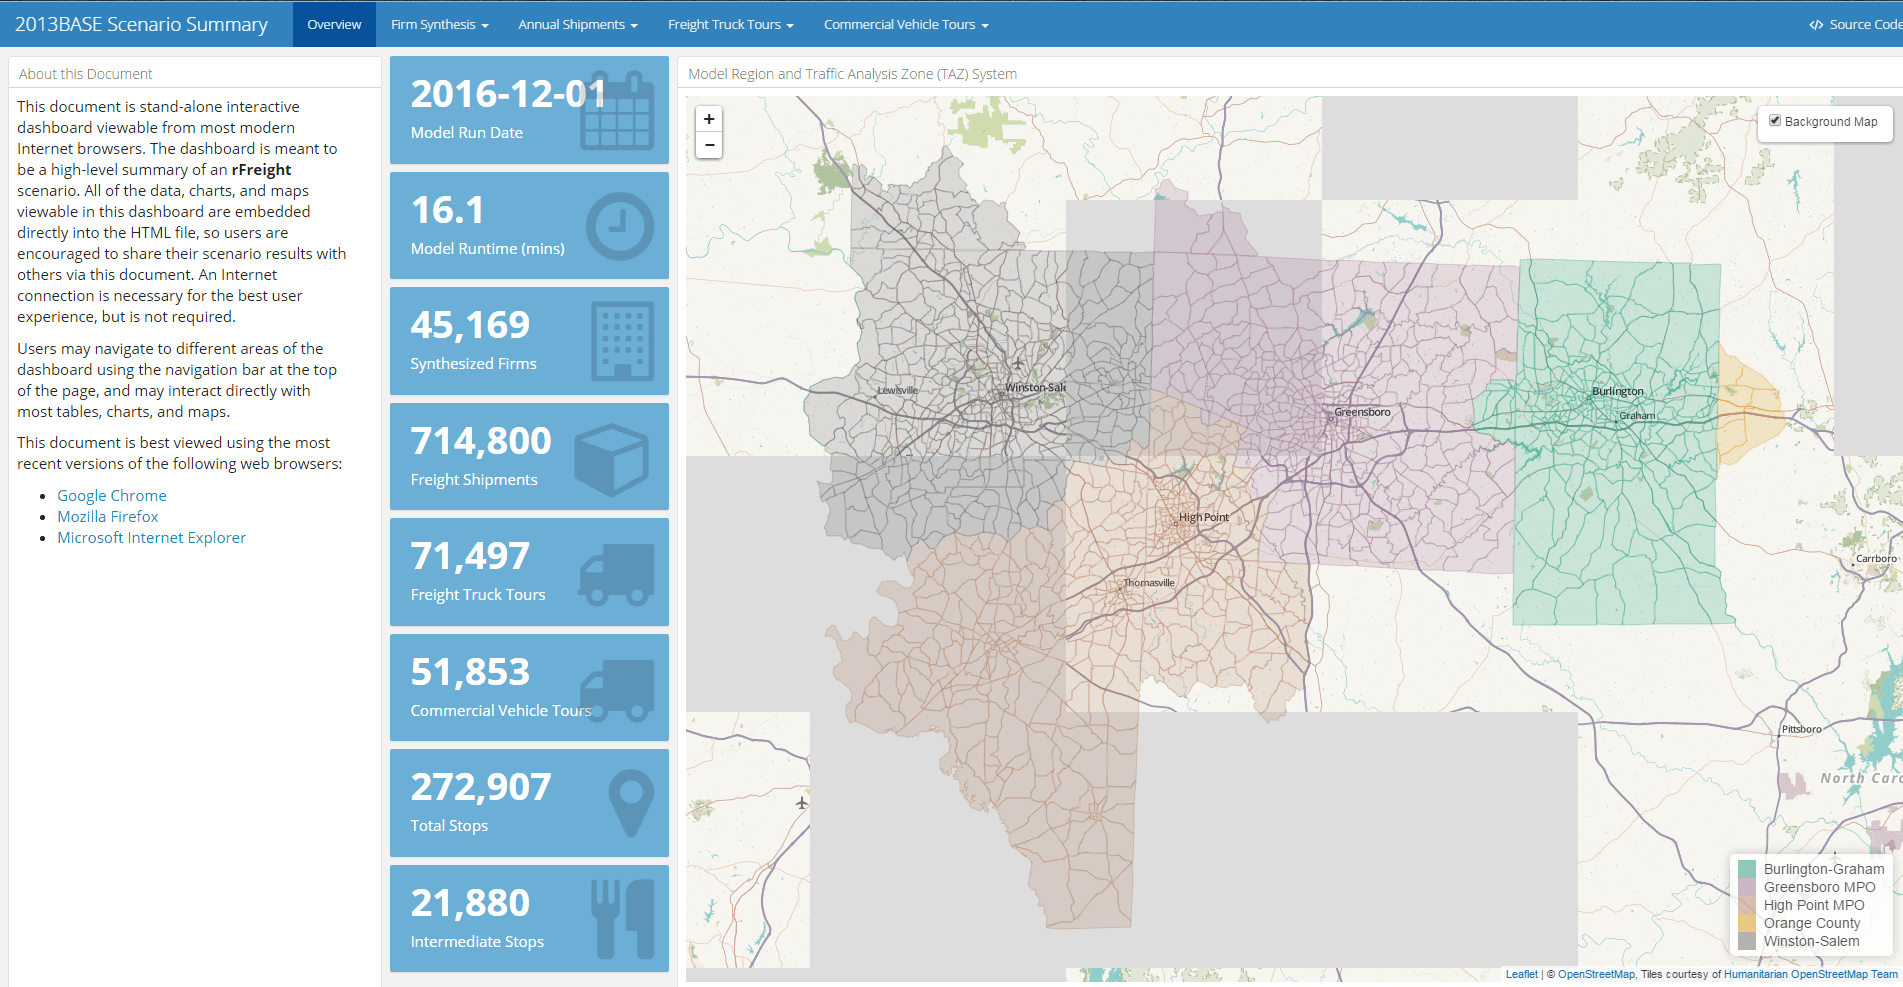
The FTTM also contains a graphical user interface. All output from the model can easily be viewed by anyone with a web browser.
Supporting Documents
Phase III
Conduct travel diary survey to update the freight sub-model developed in the previous phase.
Phase III is managed by NCDOT and PART. The focus is the:
- Collection of behavioral data through local sampling and
- The re-estimation of freight model components and full re-calibration and validation of the freight model developed in Phase II.
NCDOT and PART hopes that the establishment and truck diary surveys and other data collection will incorporate existing data sources that can be used by other regions in the state. Phase III started in November 2018 and was originally scheduled to be completed in October 2019. However, the truck driver diary survey was rescheduled to meet the sample size specified in the scope of work. Progress as of May 2020 is outlined below:
Task 1: Survey Practice Review and Survey Plan (100% complete).
Task 1 was completed as of the end of December 2018.
Task 2: Survey Design and Sampling Plan (100% complete).
Task 2 was completed as of the end of February 2019.
Task 3: Survey Preparation and Pretests (100% complete).
Task 3 was complete as of the end of May 2019.
Task 4: Survey Recruitment and Implementation (50% complete).
RSG and Planning Communities are following up with drivers and businesses met with during the on-site fieldwork.
Task 4 is postponed due to Covid-19 and will be rebooted when traffic condition goes back to normal. (TBD).
Task 5: QA/QC and Data Weighting (25% complete).
RSG is reviewing the truck diary data collected during the first phase of in-person fieldwork and the initial responses by truck drivers recruited by the establishment invitations RTI has mailed all 8000 invitations to establishments and has begun follow up calls to interview establishment.
Task 5 is postponed due to Covid-19 and will proceed when the survey samples at the appropriate size required for the calibration through the extended survey are ready. (TBD).
Task 6: Freight Model Estimation and Calibration (45% complete).
RSG is working on updating freight model inputs such as commodity flow data in preparation for initial model re-estimation using the first portion of the truck diary survey data collected in field.
Final estimation and calibration of the freight model will be completed once the survey data are complete and other updated inputs such as the refreshed Phase 1 freight node database are provided to RSG by PART.
Task 6 is postponed due to Covid-19. (TBD)